🚀 Analyse 1: Diachrone Frequenzdiagramme#
Hinweise zur Ausführung des Notebooks#
Dieses Notebook kann auf unterschiedlichen Levels erarbeitet werden (siehe Abschnitt “Technische Voraussetzungen”):
Book-Only Mode
Cloud Mode: Dafür auf 🚀 klicken und z.B. in Colab ausführen.
Local Mode: Dafür auf Herunterladen ↓ klicken und “.ipynb” wählen.
Übersicht#
Im Folgenden werden die annotierten Dateien (CSV-Format) analysiert. Unser Ziel ist es, die Wort-/Lemma-Häufigkeiten einer vordefinierten Wortgruppe für die Monate des Jahres 1918 zu plotten und zu sehen, ob sie mit den Wellen der Grippepandemie korrelieren. Dafür werden folgendene Schritte durchgeführt:
Einlesen des Korpus, der Metadaten und der Grippe-Wortliste
Extraktion der Worthäufigkeiten und Plotten der Worthäufigkeiten
Diskussion der Ergebnisse
Informationen zum Ausführen des Notebooks – Zum Ausklappen klicken ⬇️
Voraussetzungen zur Ausführung des Jupyter Notebooks
- Installieren der Bibliotheken
- Pfad zu den Daten setzen
- Laden der Daten (z.B. über den Command `wget` (s.u.))
Show code cell content
#  🚀 Install libraries
! pip install pandas bokeh
Show code cell content
import re
import requests
from pathlib import Path
import pandas as pd

# for interactivity in jupyter books
#from bokeh.application import Application
#from bokeh.application.handlers import FunctionHandler
from bokeh.io import output_notebook, show
from bokeh.plotting import figure
from bokeh.layouts import column, row
from bokeh.models import ColumnDataSource, CustomJS, TextInput, Div, RadioButtonGroup, Switch
# Ensure Bokeh output is displayed in the notebook
output_notebook()
1. Einlesen der Daten, Metadaten und der Grippe-Wortliste#
Um eine/mehrere Dateien mit Python bearbeiten zu können, müssen die Dateien zuerst ausgewählt werden, d.h der Pfad zu den Dateien wird gesetzt, und dann eingelesen werden.
1.1 Einlesen des Korpus (CSV-Dateien)#
Informationen zum Ausführen des Notebooks – Zum Ausklappen klicken ⬇️
Zuerst wird der Ordner angelegt, in dem die CSV-Dateien gespeichert werden. Der Einfachheit halber wird die gleich Datenablagestruktur wie in dem GitHub Repository, in dem die Daten gespeichert sind, vorausgesetzt. Danach werden alle CSV-Dateien im Korpus heruntergeladen und gespeichert. Dafür sind folgende Schritte nötig:- Es wird eine Liste erstellt, die die URLs zu den einzelnen CSV-Dateien beinhaltet.
- Die Liste wird als txt-Datei gespeichert.
- Alle Dateien aus der Liste werden heruntergeladen und in dem Ordner ../data/csv gespeichert.
Show code cell content
# 🚀 Create data directory path
corpus_dir = Path("../data/csv")
if not corpus_dir.exists():
    corpus_dir.mkdir()
Show code cell content
# 🚀 Create download list
github_api_txt_dir_path = "https://api.github.com/repos/dh-network/quadriga/contents/data/csv"
txt_dir_info = requests.get(github_api_txt_dir_path).json()
url_list = [entry["download_url"] for entry in txt_dir_info]

# 🚀 Write download list as txt file
url_list_path = Path("github_csv_file_urls.txt")
with url_list_path.open('w') as output_txt:
    output_txt.write("\n".join(url_list))
Show code cell content
# ⚠️ Only execute, if you haven't downloaded the files yet!
# 🚀 Download all csv files – this step will take a while (ca. 7 minutes)
! wget -i github_csv_file_urls.txt -P ../data/csv
Setzen des Pfads:
# set the path to csv files to be processed
csv_dir = Path(r"../data/csv")
Einlesen der CSV-Dateien
# Create dictionary to save the corpus data (filenames and tables)
corpus_annotations = {}

# Iterate over csv files
for file in csv_dir.iterdir():
    # check if the entry is a file, not a directory
    if file.is_file():
        # check if the file has the correct suffix csv
        if file.suffix == '.csv':
            # read the csv table to a data frame
            data = pd.read_csv(file)
            # save the data frame to the dictionary, key=filename (without suffix), value=dataframe
            corpus_annotations[file.with_suffix("").name] = data
Wie viele Dateien wurden eingelesen?
len(corpus_annotations)
1323
Wie sieht der Anfang der ersten Datei aus?
corpus_annotations[list(corpus_annotations.keys())[0]].head()
| Token | Lemma | |
|---|---|---|
| 0 | Sir | Sir |
| 1 | 127 | 127 |
| 2 | ' | -- |
| 3 | Abenb-Andzate | Abenb-Andzat |
| 4 | : | -- |
1.2 Einlesen der Metadaten#
Informationen zum Ausführen des Notebooks – Zum Ausklappen klicken ⬇️
Zuerst wird der Ordner angelegt, in dem die Metadaten-Datei gespeichert wird. Wieder wird die gleich Datenablagestruktur wie in dem GitHub Repository vorausgesetzt. Der Text wird aus GitHub heruntergeladen und in dem Ordner ../data/metadata/ abgespeichert. Der Pfad kann in der Variable metadata_path angepasst werden. Die einzulesende Datei muss die Endung `.csv` haben.Show code cell content
# 🚀 Create metadata directory path
metadata_dir = Path("../data/metadata")
if not metadata_dir.exists():
    metadata_dir.mkdir()
Show code cell content
# 🚀 Load the metadata file from GitHub
! wget https://raw.githubusercontent.com/dh-network/quadriga/refs/heads/main/data/metadata/QUADRIGA_FS-Text-01_Data01_Corpus-Table.csv -P ../data/metadata
# set path to metadata file
metadata_path = '../data/metadata/QUADRIGA_FS-Text-01_Data01_Corpus-Table.csv'

# read metadata file to pandas dataframe
corpus_metadata = pd.read_csv(metadata_path, sep=';')
corpus_metadata['DC.date'] = pd.to_datetime(corpus_metadata['DC.date'])
#corpus_metadata = corpus_metadata.set_index('DC.identifier')
Wie sieht die Metadaten-Datei aus? (erste fünf Zeilen)
corpus_metadata.head()
| DC.identifier | DC.publisher | DC.date | DC.source | |
|---|---|---|---|---|
| 0 | SNP2719372X-19180101-0-0-0-0 | Berliner Morgenpost | 1918-01-01 | https://content.staatsbibliothek-berlin.de/zef... |
| 1 | SNP2719372X-19180102-0-0-0-0 | Berliner Morgenpost | 1918-01-02 | https://content.staatsbibliothek-berlin.de/zef... |
| 2 | SNP2719372X-19180103-0-0-0-0 | Berliner Morgenpost | 1918-01-03 | https://content.staatsbibliothek-berlin.de/zef... |
| 3 | SNP2719372X-19180104-0-0-0-0 | Berliner Morgenpost | 1918-01-04 | https://content.staatsbibliothek-berlin.de/zef... |
| 4 | SNP2719372X-19180105-0-0-0-0 | Berliner Morgenpost | 1918-01-05 | https://content.staatsbibliothek-berlin.de/zef... |
1.3 Einlesen der Wortliste (Semantisches Feld “Grippe”)#
Informationen zum Ausführen des Notebooks – Zum Ausklappen klicken ⬇️
Parallel zur Metadaten-Datei wird ein Ordner für die Wortlisten-Datein angelegt, die Datei wird aus GitHub geladen und in dem erstellten Ordner abgelegt.Show code cell content
# 🚀 Create word list directory path
wordlist_dir = Path("../data/wordlist")
if not wordlist_dir.exists():
    wordlist_dir.mkdir()
Show code cell content
# 🚀 Load the wordlist file from GitHub
! wget https://raw.githubusercontent.com/dh-network/quadriga/refs/heads/main/data/wordlist/grippe.txt -P ../data/wordlist
path_to_wordlist = Path("../data/wordlist/grippe.txt")
word_list = path_to_wordlist.read_text().split("\n")
Wie sieht die Wortliste aus?
word_list
['Influenza',
 'Grippe',
 'Grippeepidemie',
 'Grippewelle',
 'Grippekranke',
 'Grippepandemie',
 'Lungenentzündung',
 'Krankheitswelle',
 'Seuchenzug',
 'Krankheitsausbruch',
 'Fieberanfall',
 'Schüttelfrost',
 'Atemnot',
 'Körpererschöpfung',
 'Genesungszeit',
 'Ansteckungsgefahr',
 'Seuchenschutz',
 'Desinfektionsmittel',
 'Schutzmaske',
 'Krankenstation',
 'Isolationsstation',
 'Sanitätsdienst',
 'Krankheitsverlauf',
 'Todesopfer',
 'Krankheitssymptom',
 'Erkrankungsfall',
 'Lungeninfektion',
 '']
2. Suche nach einem Lemma und plotte die Häufigkeit#
Datum zu den Annotationen hinzufügen
Annotationen in einer Datenstruktur (einem DataFrame) speichern
Lemmata suchen und nach Zeitabschnitt gruppieren
Häufigkeiten plotten
2.1 Datum zu den Annotationen hinzufügen#
def add_date_to_corpus_annotations(corpus_metadata: pd.DataFrame, corpus_annotated: dict[str, pd.DataFrame]) -> None:
    """Add date colum from corpus_metadata to corpus annotated. Map by DC.identifier / filename."""
    for identifier, df in corpus_annotated.items():
        if identifier in corpus_metadata["DC.identifier"].values:
            df["date"] = corpus_metadata[corpus_metadata["DC.identifier"] == identifier]["DC.date"].item()
add_date_to_corpus_annotations(corpus_metadata, corpus_annotations)
2.2 Annotationen in einer Datenstruktur (einem DataFrame) speichern#
corpus_annotations_merged = pd.concat(corpus_annotations.values())
2.3 Berechnen der absoluten und relativen Häufigkeiten zusammengefasst pro Tag, Woche und Monat#
def search_split_by_timeframe(merged_df: pd.DataFrame, search_terms=word_list) -> tuple[dict[str, pd.DataFrame], dict[str, pd.DataFrame]]:
    """Get lemmata count of words in search_terms by month, week and days.
    Plot frequencies using plot_with_js function.
    :param pd.DataFrame merged_df: The merged dataframe of all annotations
    :param list search_terms: List of words to search in merged_df
    :return tuple: Two dictionaries with identical keys, saving the absolute and relative frequencies by three time frames respectively
    """
    # Filter dataframe by lemmata in word_list
    result = merged_df.query(f'Lemma.isin({search_terms})')

    # Collect lemmata count by time frames: month, week, day
    frequency_parameters = ["M", "W-MON", "D"]
    absolute_frequencies = {option: result.groupby(pd.PeriodIndex(result['date'], freq=option)).count().Lemma
                            for option in frequency_parameters}

    relative_frequencies = {}
    for frequency_param in frequency_parameters:
        relative_frequencies[frequency_param] = absolute_frequencies[frequency_param] / merged_df.groupby(pd.PeriodIndex(merged_df['date'], freq=frequency_param)).count().Lemma.fillna(0)

    return absolute_frequencies, relative_frequencies
2.4 Erstellen eines interaktiven Liniendiagramms#
def plot_with_js(merged_df: pd.DataFrame, search_terms=word_list) -> None:
    """
    Get lemmata count of words in search_terms by month, week and days using search_split_by_timeframe
    Interactively plot frequencies using bokeh and javascript callback.
    :param pd.DataFrame merged_df: The merged dataframe of all annotations
    :param list search_terms: List of words to search in merged_df
    """

    # Get frequencies of lemmata in word_list by timeframe
    absolute_frequencies, relative_frequencies = search_split_by_timeframe(merged_df, search_terms=search_terms)

    # Prepare data sources
    absolute_sources = {key: dict(x=val.index, y=list(val)) for key, val in absolute_frequencies.items()}
    relative_sources = {key: dict(x=val.index, y=list(val)) for key, val in relative_frequencies.items()}

    # Set month as default for the plot
    line_source = ColumnDataSource(data=absolute_sources["M"])

    # Create a plot
    p = figure(title=f"Frequency of words {search_terms}", x_axis_type="datetime", x_axis_label='Time',
               y_axis_label='Frequency', width=700, height=400)
    line = p.line('x', 'y', source=line_source, line_width=2, color='blue')

    # RadioButtonGroup to select mode
    radio_button_group = RadioButtonGroup(labels=["Monthly", "Weekly", "Daily"], active=0)
    switch_title = Div(text="<b style='color: blue;'>Relative Frequencies:</b>")
    switch = Switch(active=False)

    # Callback to update the data based on selected mode
    callback = CustomJS(
        args=dict(
            line=line,
            absolute_sources=absolute_sources,
            relative_sources=relative_sources,
            radio_button_group=radio_button_group,
            switch_element=switch,  # rename this because "switch" is a keyword in JS
        ),
        code="""
        // Access the value of the switch
        const sources = switch_element.active ? relative_sources : absolute_sources;

        // Access the value of the RadioButtonGroup
        const mode = radio_button_group.active;

        // Retrieve the selected frequency
        const freq = ["M", "W-MON", "D"][mode];

        // update data source and emit change event
        line.data_source.data = sources[freq];
        line.data_source.change.emit();
    """,
    )

    # Attach the callback to both widgets
    radio_button_group.js_on_change('active', callback)
    switch.js_on_change("active", callback)

    # Layout the RadioButtonGroup and plot
    layout = column(row(radio_button_group, switch_title, switch), p)
    show(layout)
# Call the function to plot the frequencies
plot_with_js(corpus_annotations_merged, search_terms=word_list)
Worteingabe für die Suche (für Cloud Mode und Local Mode)#
Show code cell content
text_input = input("Geben Sie die zu suchenden Wörter ein und trennen Sie sie durch Kommas, wenn es mehrere sind:")
# Convert the input to a list by splitting the input by comma
text_input = [x.strip() for x in text_input.split(',')]
Show code cell content
plot_with_js(corpus_annotations_merged, search_terms=text_input)
3. Diskussion des Zwischenergebnisses#
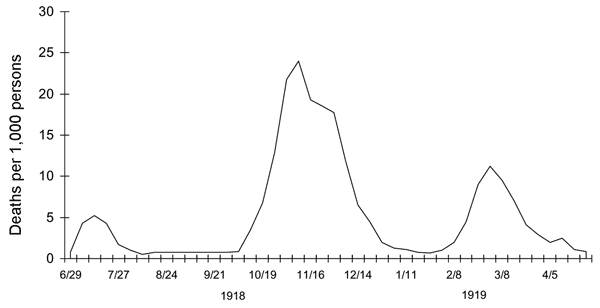
Ist dieses Ergebnis sinnvoll und spiegelt es tatsächlich etwas wider? Eine Möglichkeit, dies zu überprüfen, besteht darin, unser Diagramm mit den tatsächlichen Daten über die Intensität der Pandemie zu vergleichen.
In Taubenberger & Morens (2006) wird festgestellt, dass ‘The first pandemic influenza wave appeared in the spring of 1918, followed in rapid succession by much more fatal second and third waves in the fall and winter of 1918–1919, respectively’(‘Die erste pandemische Influenza-Welle im Frühjahr 1918 auftrat, gefolgt von weitaus tödlicheren zweiten und dritten Wellen im Herbst und Winter 1918–1919’). Sie ergänzen diese Aussage auch mit einem Diagramm aus einem früheren Papier (Jordanm 1927):

Unsere zwei Wellen der Erwähnungen des Wortes ‘Grippe’ scheinen den Sterblichkeitszahlen zu entsprechen, was darauf hindeuten könnte, dass die Methode, obwohl sehr einfach, funktioniert und dass historische Ereignisse manchmal in Wortfrequenzzählungen reflektiert werden können… Die dritte Welle scheint nicht reproduziert zu werden, was eine weitere Untersuchung erfordert. Eine Hypothese könnte sein, dass, ähnlich wie bei der COVID-Pandemie, neue Krankheitswellen irgendwann aufhören, die Aufmerksamkeit der Öffentlichkeit zu erregen. Beispielsweise waren die COVID-Wellen im Jahr 2021 stärker als die im Jahr 2020, aber die Berichterstattung in den Nachrichten nahm bereits ab. Dies könnte besonders für Anfang 1919 zutreffen, als nach dem Verlust des Krieges und der Revolution von 1918 Grippetodesfälle kein Nachrichtenthema mehr waren.
Bibliographie#
Jordan E. (1927). Epidemic influenza: a survey. Chicago: American Medical Association.
Taubenberger, J. K., & Morens, D. M. (2006). 1918 Influenza: the Mother of All Pandemics. Emerging Infectious Diseases, 12(1), 15-22. https://doi.org/10.3201/eid1201.050979

